Measuring Electric Power Consumption and Production
The way I measure the power consumption of various devices in our Smart Passive House, store it in a database and never lose track of it.
Since we live in our passive house, I became interested in the power consumption of our house. It began with the fact that I wanted to know the percentage of the heating costs of our heat pump in our total power consumption. Besides, I also found the evaluation of load peaks and the analysis of the constant current consumption very interesting. When we built our photovoltaic system, an unbelievable number of possibilities came together to analyze the output of our system.
Thus, I can now evaluate if the PV system produces the power that was predicted during the planning and how the performance of the system changes over the lifetime. But I do not only collect the data just out of curiosity. This data is also the basis to increase my consumption of the generated electricity with the help of automation and to save money. The details of what I measure and how I collect, store and evaluate the data is part of this blog post.
What I measure:
For a comprehensive analysis of the power consumption and power production of our passive house I collect the following data:
- Heating consumption
- Ventilation consumption
- Total consumption
- Household consumption
- can be calculated from total consumption - heating consumption - ventilation consumption
- PV Production
- AC Side
- DV Side
- Data for monitoring and failure statistics of the entire system
In addition to the data on the overall electricity consumption, I also specifically record the consumption of our heat pump and ventilation system. The consumption of the remaining household power can then be calculated from the difference between total consumption and heating or ventilation consumption.
How I measure:
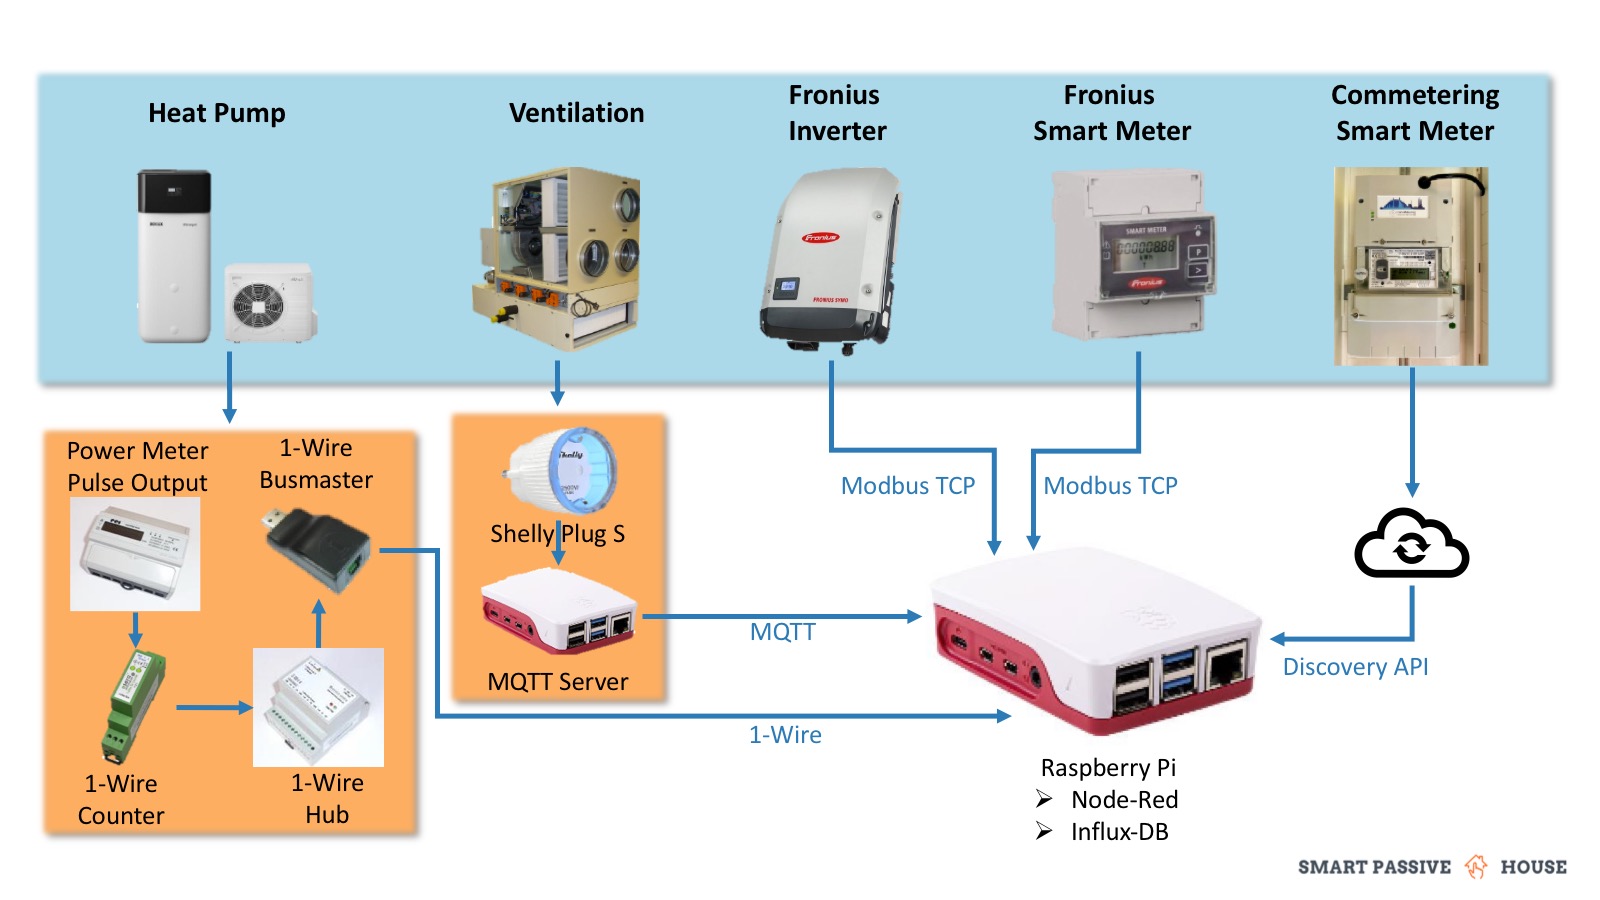
Power Measurement Architecture
-
1-Wire
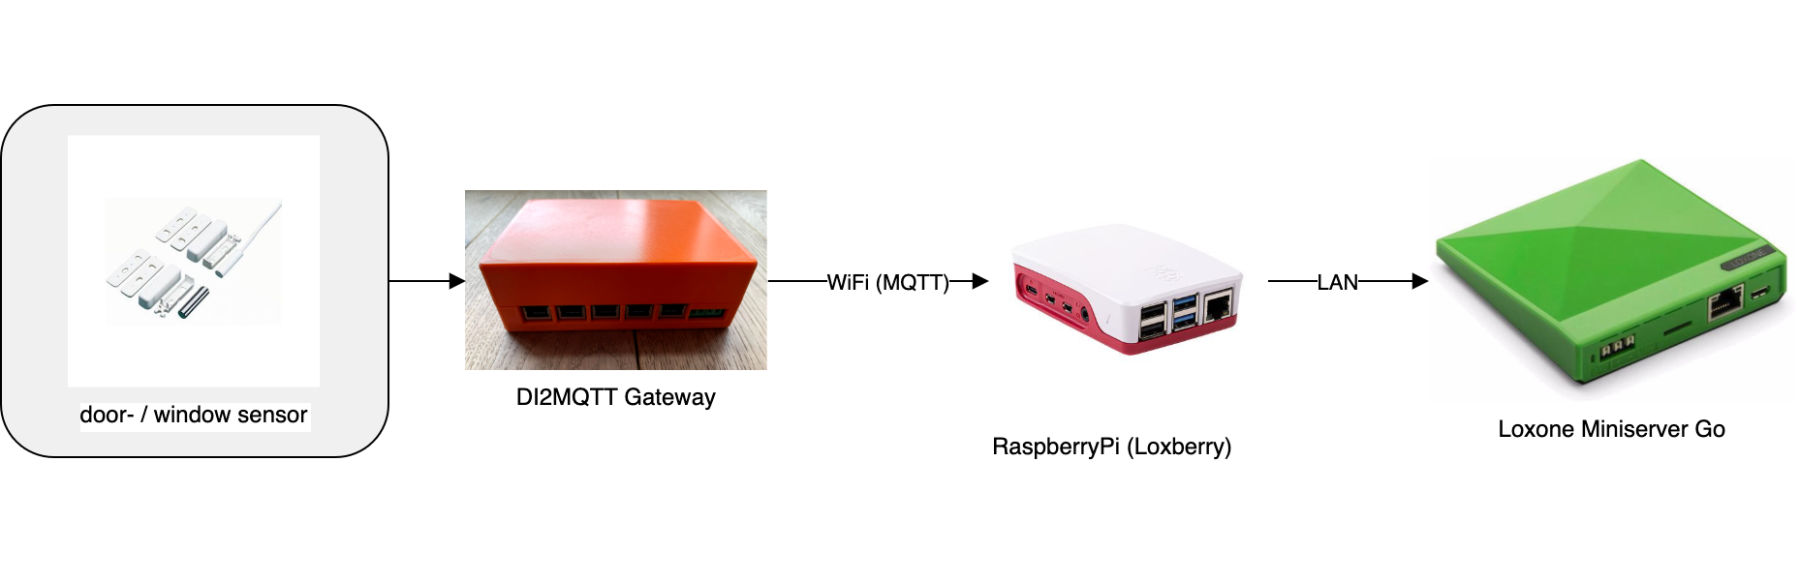
I record the consumption of our heat pump via the 1-wire bus. The measuring sequence begins with a 3-phase electricity meter in the electric meter cabinet to which only the heat pump is connected. The meter has an impulse output that gives out 800 impulses per kWh consumed. I record these impulses with a 1-Wire impulse counter which counts each impulse and thus gives me a constantly increasing meter value. To ensure a stable operation of the 1-Wire bus and to provide the necessary supply voltage for the pulse module I use a 1-Wire hub. Using a 1-Wire USB adapter I then read the values via a Raspberry Pi into Node-RED.
The measurement using 1-Wire is my longest-running and at the same time the most complex measuring method compared to the following ones. -
Shelly Plug S with MQTT
I record the consumption of our fresh air heater via a Shelly Plug S. This is actually a smart plug adapter which has an additional power measuring function. I have configured the Shelly so that it is always set to “on” by default. Even after a power outage our fresh air heater continues to run and is not interrupted by the plug adapter. The Shelly sends the measured values via MQTT to a MQTT broker on one of my Raspberry Pi and from there to Node-RED.
This measuring method is much simpler than the 1-Wire measurement, much cheaper and for any number of devices you can reach the plug of the connector (in case of a refrigerator e.g. not always that easy). -
Modbus TCP
I import all values from our photovoltaic system (Inverter & Smart Meter) via Modbus TCP directly into Node-RED. In opposite to the methods described before, no further devices are necessary. Therefore I had to activate the data transmission via Modbus TCP in our inverter and configure the corresponding input node in Node-RED. More details about how to read out the Fronius Inverter and Smart Meter data into Node-RED can be found here in the photovoltaic forum (german only). -
Cloud API
I read the data of our calibrated Smart Meter into Node-RED via an API from the portal of Discovergy. This is the only measurement concept which does not provide any measurement data without an internet connection. Some of the values retrieved are also provided by the Smart Meter of my photovoltaic system and are therefore duplicated in the database. But on the one hand, it is good for me to have the values available on a second channel in case of a short term failure of one source. On the other hand, I can compare the data of the Discovergy Smart Meter and the Fronius Smart Meter and validate them.
The four measurement concepts described in this article differ in complexity and hardware costs but are all required for the different devices I need to measure. In the next step, I will explain how I can permanently save and evaluate the measured values collected in Node-RED.
Save measurements
All previously described measurement methods end in Node-RED. This is where I save the measurement data into the time series database InfluxDB, which is perfectly qualified for IoT measurements. You can download my current Node-RED implementation here. To get the flow working you should first install the following extensions:
node-red-contrib-influxdb
node-red-contrib-modbus
node-red-node-discovery
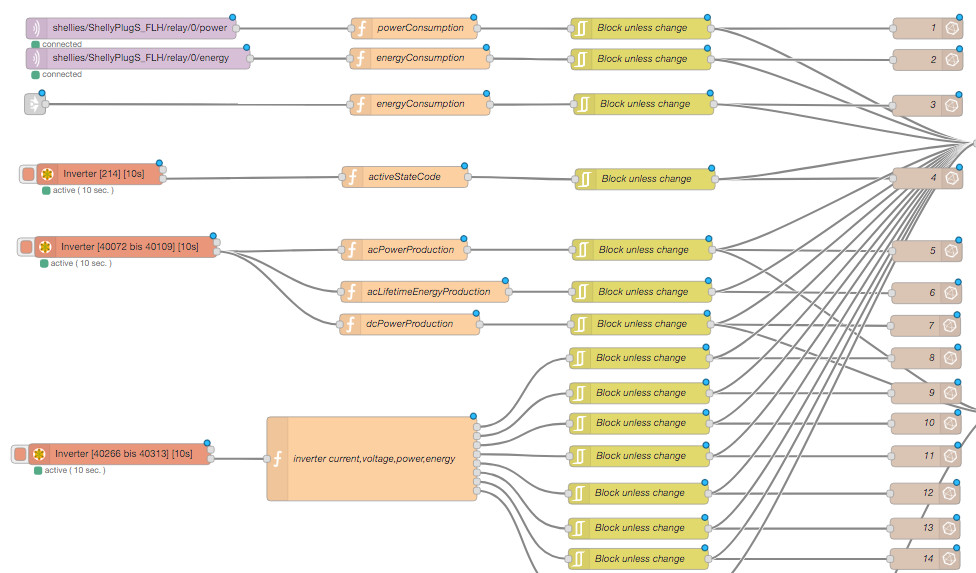
Power Measurement Node-RED
In order to be able to find and process the measurement data in the Influx database later on, I save some meta data to the measurement values themselves. In order to retain the overview I have created a table with all the associated metadata.
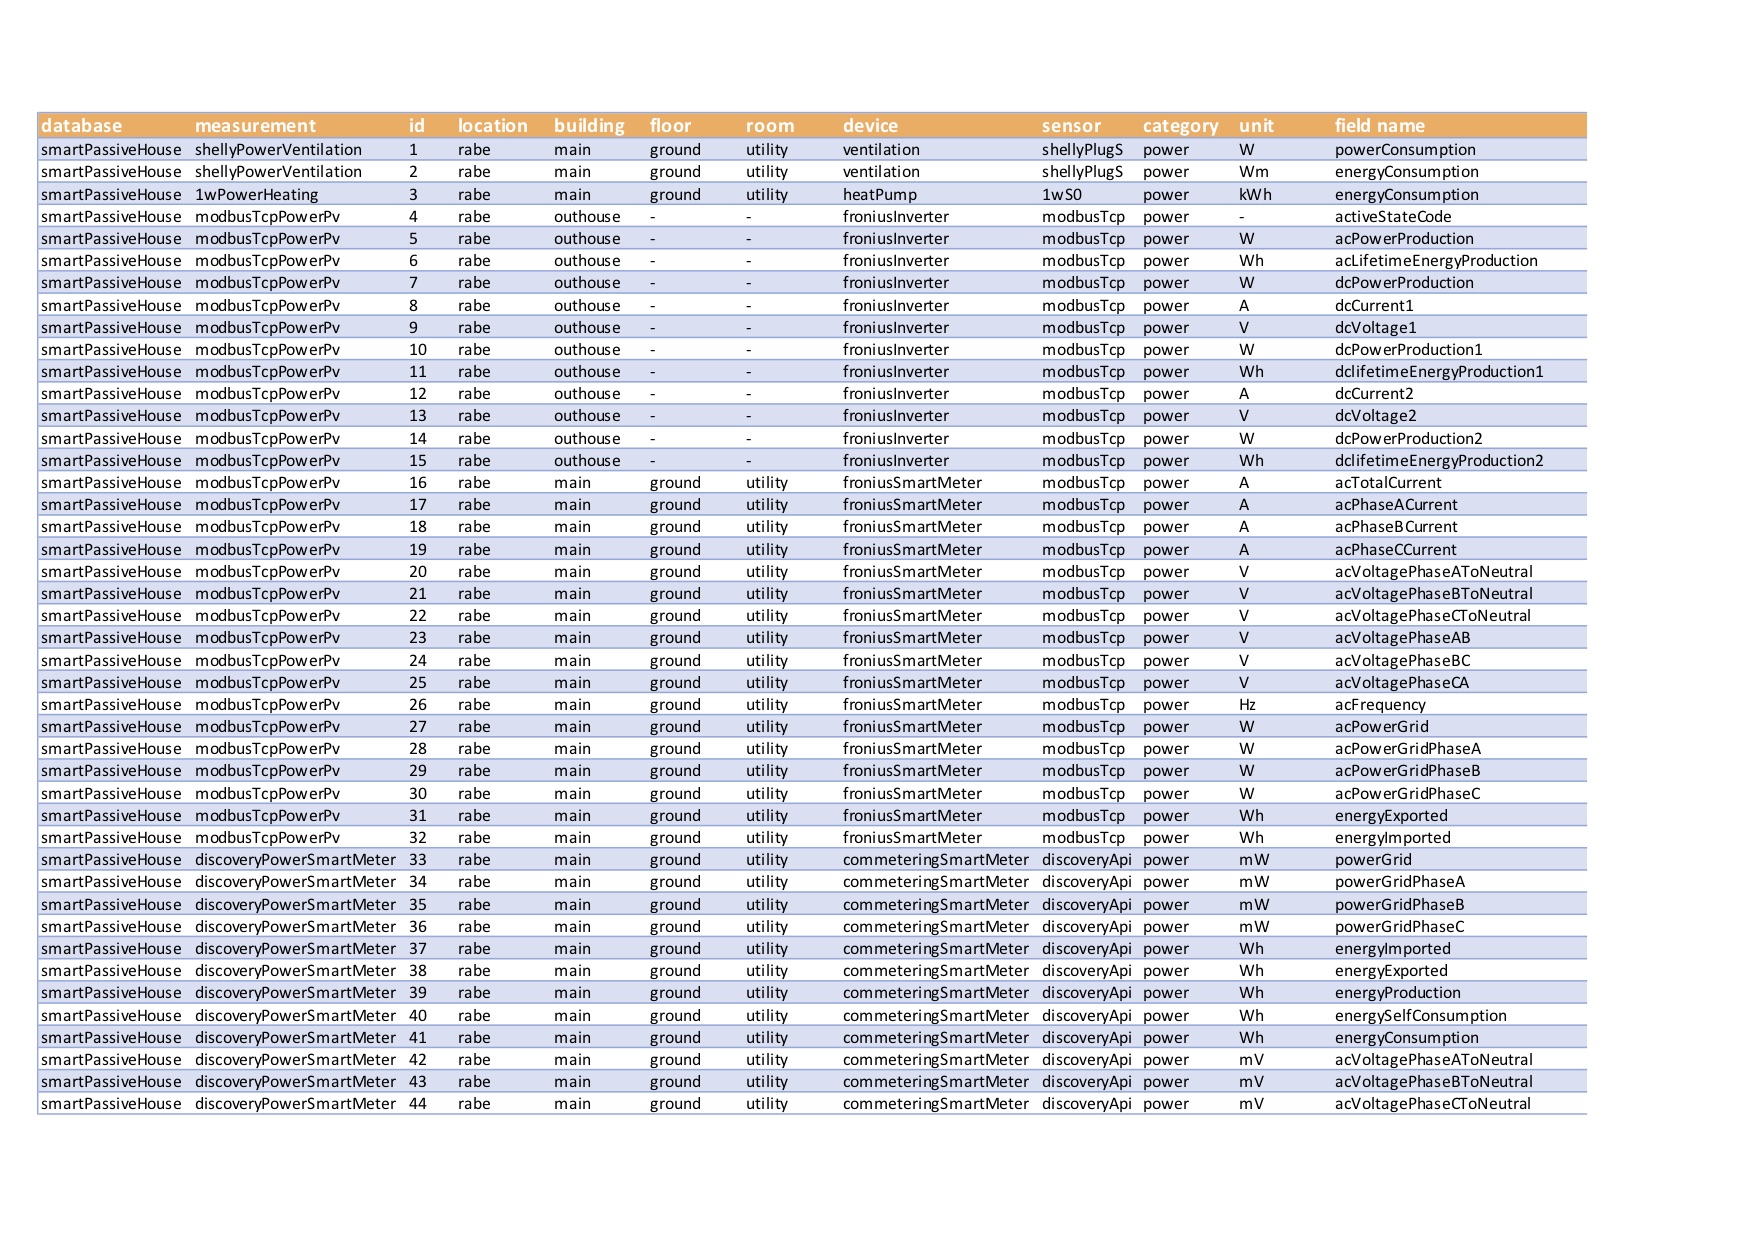
Power Measurement Data Overview
InfluxDB Example Commands
The following commands show examples of the powerful analyses that can be done with InfluxDB and some simple calls on the console:
Preparation:
- start Influx on the console / terminal:
influx -precision rfc3339
the precision parameter ensures easy to read timestamps use SmartPassiveHouseName of the database in which we have stored our measured values
Power consumption in the last 24h
> SELECT SPREAD("energyConsumption") FROM "discoveryPowerSmartMeter" WHERE time > now() - 1d
name: discoveryPowerSmartMeter
time                           spread
----                           ------
2020-11-09T20:27:10.146617842Z 26915
average power consumption from the power grid in the last 30 days
> SELECT MEAN("acPowerGrid") FROM "modbusTcpPowerPv" WHERE time > now() - 30d
name: modbusTcpPowerPv
time                           mean
----                           ----
2020-10-11T20:26:26.357328301Z 285.2160492652098
Highest current consumption in the last 2 weeks
> SELECT MAX("acPowerGrid") FROM "modbusTcpPowerPv" WHERE time > now() - 14d
name: modbusTcpPowerPv
time                     max
----                     ---
2020-11-10T16:44:33.944Z 8867
Data Traffic
The size of the Influx database depends very much on the number of measurement data, the frequency of new entries and the metadata used and is therefore very individual. But you can check the size of your database with :
du -sh /var/lib/influxdb/data/
Where /var/lib/influxdb/data is the data directory defined in influxdb.conf.
Compare this value with the free disk space of the whole system to see if the storage space is running low:
df -h
Summary & Forecast
In this blog post, I have shown why I want to collect extensive measurement data on power consumption and production in our Smart Passive House. I have described how to measure, process and store the data in the timeseries database InfluxDB. I also gave you a short insight into the commands of InfluxDB and the amount of data that is generated during storage.
I did not mention the retention functions of InfluxDB, which automatically delete old values to prevent the database from becoming unnecessarily huge.
In a future post, I will describe how I visualize the recorded data not just on the console, but in form of a super-powerful dashboard with the tool Grafana and what conclusions I have already drawn from that for our Smart Passive House.